
In September 2013, Mirvac committed to investing in a new sustainability strategy. We recognised that while there was great substance behind our sustainability work, we needed to unify our initiatives, clarify our approach and set some clear goals. The strategy we’ve developed and implemented in the past 12 months has done just that.
With a clear picture of the world we want to create, all we need to do is create it.
Susan Lloyd-Hurwitz Susan Lloyd-Hurwitz,CEO & Managing Director


 NABERS
ENERGY RATING
NABERS
ENERGY RATING

 NABERS
ENERGY RATING
NABERS
ENERGY RATING

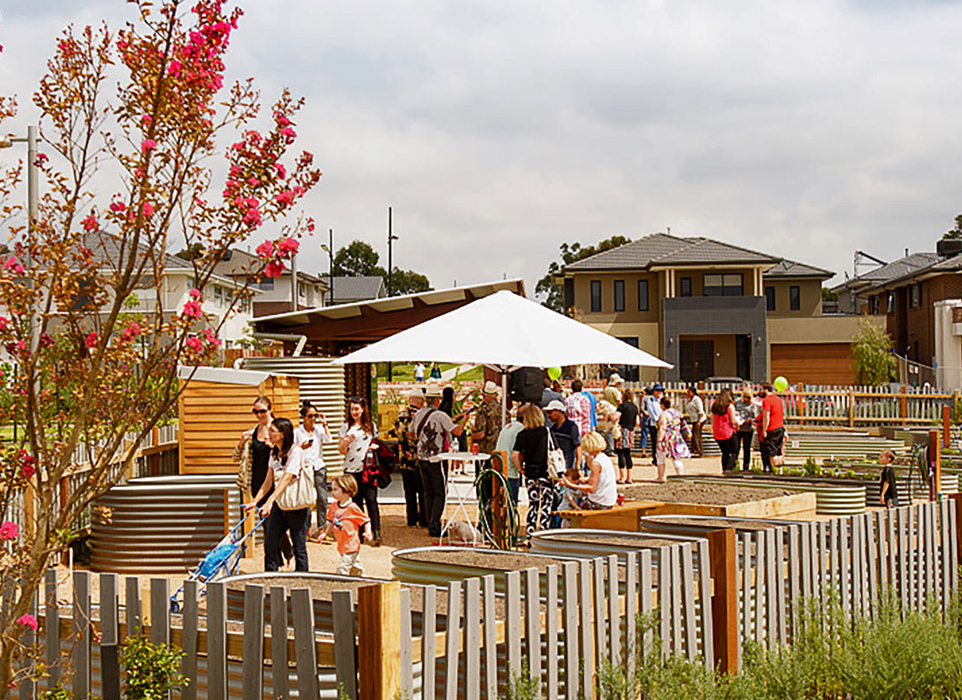
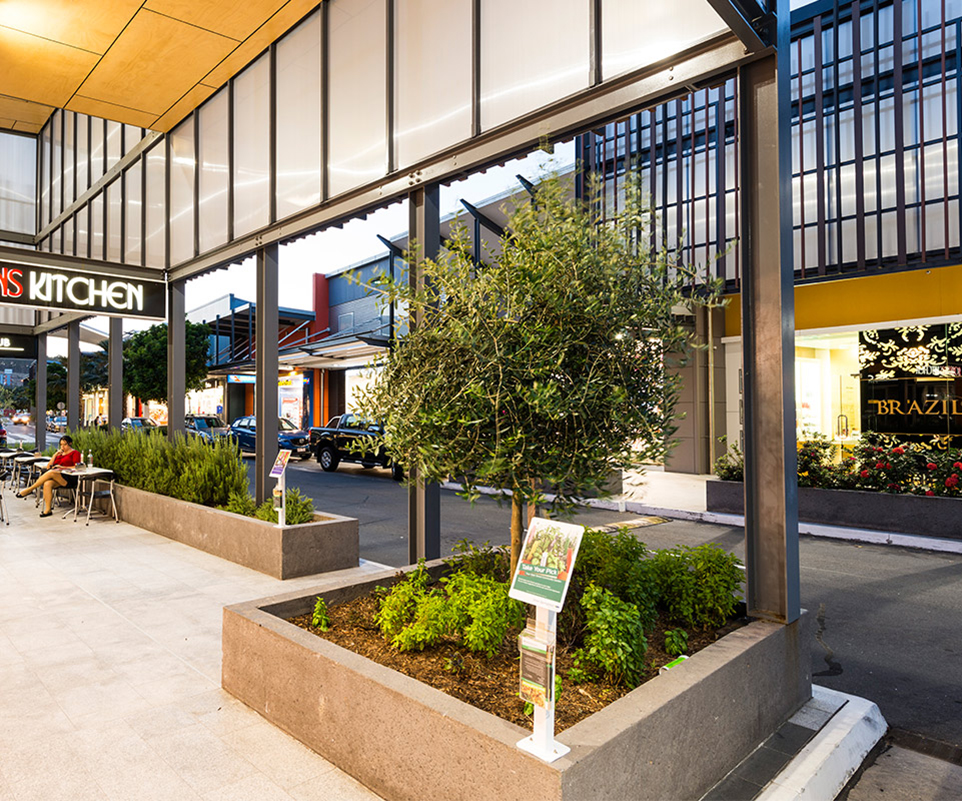
 Community gardens

 investment
 hours of support
 value of staff time
 cash donations